因为需求,所以诞生了两个R包,都是自己在周末写的,还不完善
英文版,但是英文版的说明文档还没更新及时.
第一个R包-autopca
首先取名autopca,肯定是有野心,就是水平可能支撑不了野心. 但这个R包肯定会存在各式各样的bug!,但是我还是尽力修改的.毕竟新的需求和问题也会促进人的成长.尤其是这个fix 和add都是自愿性的.
此时满心怨念的手动@我的博客主题开发者.
现在想换博主题也换不了啊,投入大量心血,现在换要从头再来
言归正穿,我的工作和组学数据处理有很大的关系,所以会经常用PCA分析,去展示样品重复性和批次效应。然而我自己有一个相对来说比较成熟的脚本的。看我以前的微信公众号链接 但是每当我操作起来的时候,总是觉得不顺畅,尤其是升职以后,领导认为我的工作职责应该转向管理和协调。所以我现在很怕领导看我自己动手做分析。但实际情况是有时候不得不去 自己动手。所以我希望能够把脚本进一步成熟,包装成R包,放在Github
废话不多说,直接上R包.
#首先第一步肯定是下载R包,目前只能在github上下载安装
#install.packages("devtools")
#devtools::install_github("wangjiaxuan666/autopca")目前autopca只有两个功能,一个是pca_data_tidy,主要负责是输入数据的清理.以保证符合输入数据的格式.另一个是PCA就是直接画图的R包.
PCA分析使用函数stat::prcomp,而prcomp的分析结果给出了输入数据的每一行样方在主成分上的方差。
简而言之,输入数据的行名,就是展现在PCA图中的点的名称.
拿R自带的数据iris来举个例子:
head(iris)## Sepal.Length Sepal.Width Petal.Length Petal.Width Species
## 1 5.1 3.5 1.4 0.2 setosa
## 2 4.9 3.0 1.4 0.2 setosa
## 3 4.7 3.2 1.3 0.2 setosa
## 4 4.6 3.1 1.5 0.2 setosa
## 5 5.0 3.6 1.4 0.2 setosa
## 6 5.4 3.9 1.7 0.4 setosanames(iris)## [1] "Sepal.Length" "Sepal.Width" "Petal.Length" "Petal.Width" "Species"可以发现iris中行名是每一株鸢尾花(样方), 而列名则是属性.画图如下:
library(autopca)
irisgroup <- iris[,5]
iristidy <- iris[,-5]
pca(iristidy,sample_group = as.data.frame(irisgroup))
## ...Notice: the sequence of sample names
## ...must be matched for the input data rownames
## ...If not,the result probably is wrong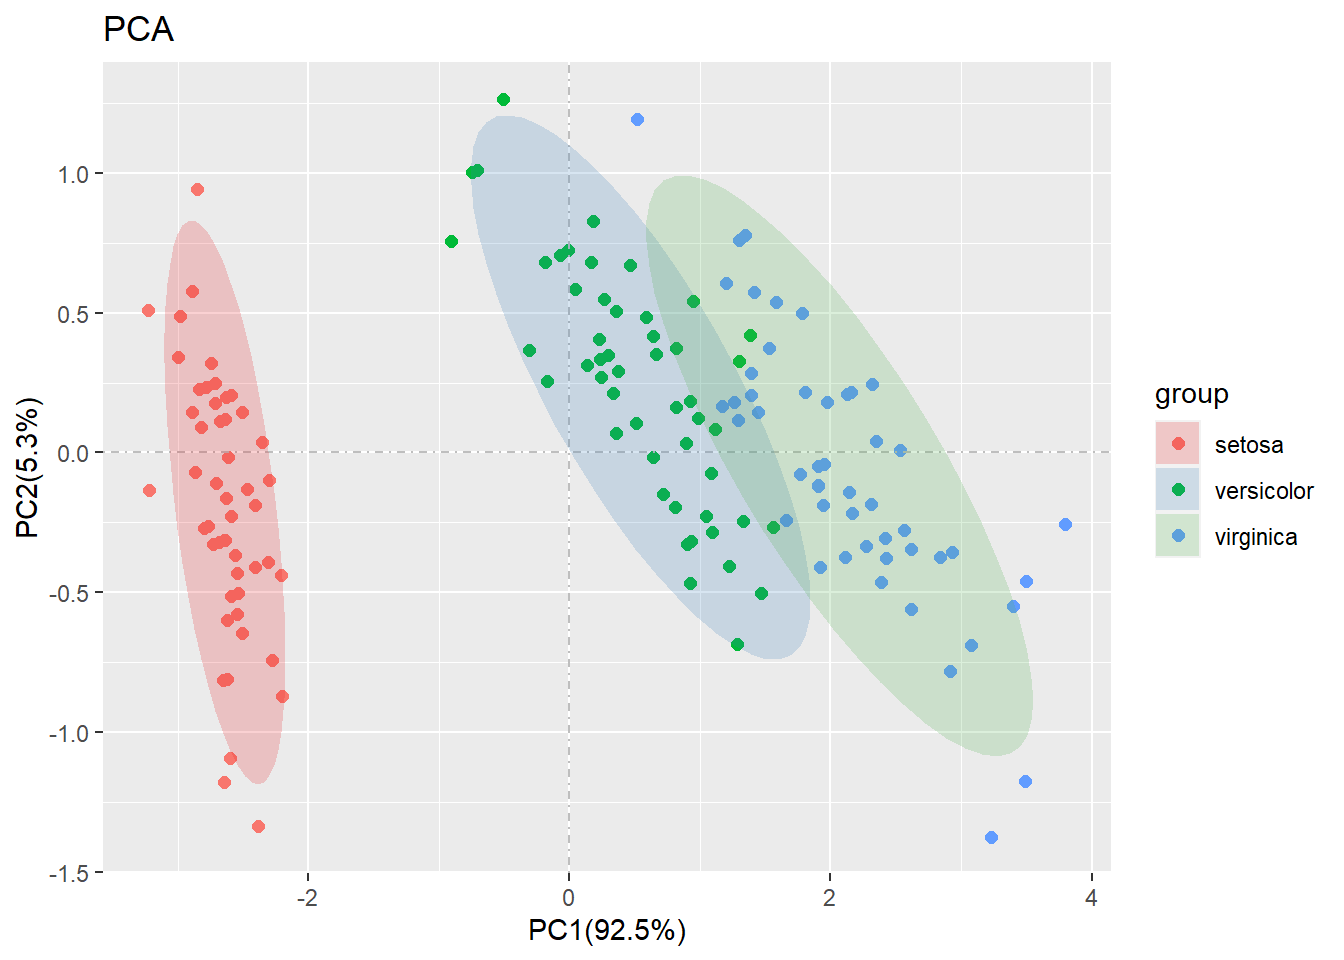 可见图中展现的点就是我们前文所述的样方,每一株的鸢尾花.可以发现不同品种的鸢尾花是存在明显的差异的. 现在我们基本明白输入数据的行名和列名的区别了.
是不是可以直接开始
可见图中展现的点就是我们前文所述的样方,每一株的鸢尾花.可以发现不同品种的鸢尾花是存在明显的差异的. 现在我们基本明白输入数据的行名和列名的区别了.
是不是可以直接开始PCA了. 不,还不行. 因为iris是内置的数据. 而现实中的数据则是五花八门.需要特别注意.所以我们需要先了解pca_data_tidy.
目前,pca_data_tidy 主要是有两个参数:
- data : 输入的数据(注意:pca_data_tidy会将输入数据转换行和列)
- id: 列名所在的列
举个例子,显示中,我们常用PCA来做组学数据,那么一个标准的组学数据样式应该,行名是基因,蛋白,代谢物等名称.而其余列名应该是样本表达量和注释信息.如下表格所示:
test = matrix(rnorm(200), 20, 10)
test[1:10, seq(1, 10, 2)] = test[1:10, seq(1, 10, 2)] + 3
test[11:20, seq(2, 10, 2)] = test[11:20, seq(2, 10, 2)] + 2
test[15:20, seq(2, 10, 2)] = test[15:20, seq(2, 10, 2)] + 4
colnames(test) = paste("Test", 1:10, sep = "")
rownames(test) = paste("Gene", 1:20, sep = "")
annot <- c(rep("KEGG",20))
test <- data.frame(test,annot)
kable(test[1:6,1:6]) %>%
  kable_styling(bootstrap_options = "striped", full_width = F) %>%
  row_spec(0, bold = T, color = "white", background = "#74a825") %>%
column_spec(1, bold = T, color = "white", background = "#D7261E")| Test1 | Test2 | Test3 | Test4 | Test5 | Test6 | |
|---|---|---|---|---|---|---|
| Gene1 | 2.839292 | 0.9250336 | 1.194169 | 0.1492772 | 1.921812 | 0.9461368 |
| Gene2 | 2.779525 | -0.9591451 | 2.763305 | 0.6668627 | 1.390754 | -1.4302568 |
| Gene3 | 4.415837 | 0.5184296 | 3.279672 | 1.2327935 | 3.848320 | -0.3416805 |
| Gene4 | 3.236780 | 1.2926798 | 2.691768 | -0.5147900 | 2.388704 | -0.3448886 |
| Gene5 | 4.119239 | 0.3637095 | 4.888072 | 0.3721374 | 3.064953 | 0.5289580 |
| Gene6 | 1.843826 | -1.2218923 | 4.954395 | -0.1691530 | 3.118710 | 0.2359191 |
而PCA只需要分析表达量数值,所以输入数据必须是numberic.如果有其类型数据输入,例如character,factor等就会报错. 同样的pca_data_tidy也是需要注意这点,
但是,pca_data_tidy可以自动过滤非数值的列.但是我仍然不建议各位依靠pca_data_tidy的自动识别.自己做的分析所需的数据,自己还是要注意的.
同时,输入的数据必须是data.frame或者tibble::tibble格式的.否则也会报错.我们利用上述的test数据来举个例子.
#使用自动识别过滤非数值的列,不能保证每次都成功
pca_data_tidy(as.data.frame(test)) -> test_tidy
## ... Notice: the input data is a data frame not a tibble
## ... Problem: the input data vaule in every column must be numberic value
## ... Problem: the error because the character type value in data
## ... Successed! the pca data save in the object可以使用str(),或者view()来查看test_tidy与test之间的差别,如果你做了,就会发现数据被转置行和列了. 如果这是对tidy_test进行PCA分析.就会发现:
这就是说,我们的输入pca_data_tidy的数据,在经过处理产生的结果,如果直接放入PCA分析中.原本的行名会变成观察值,而输入数据的列名会变成样方.
有点绕?看例子:
pca(test_tidy)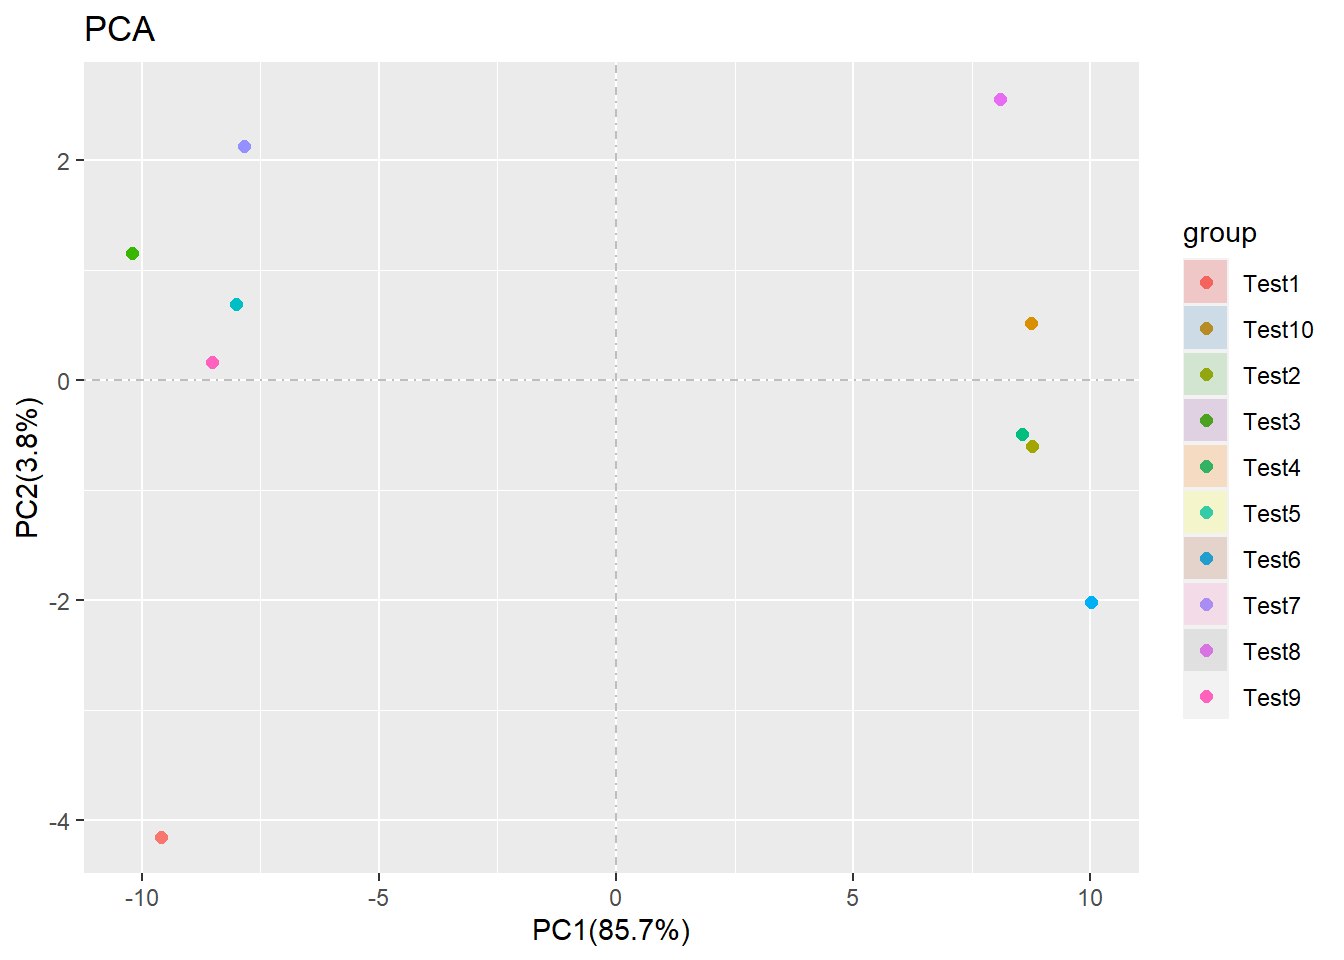
但是这个PCA图,并不是完全的,主要有三个问题:
- 缺乏PCA的参数
- 没有显示样本的名称
- 没有分组信息
因此我在pca函数中添加了以下参数:
- data: put data form the function ‘pca_data_tidy’
- center: the prcomp param, detail see ‘?prcomp’
- retx: the prcomp param, detail see ‘?prcomp’
- str_sample: the ‘regexp’ for the sample name to become the target name
- str_group: the ‘regexp’ for the group name to become the target name
- scale: the prcomp param, detail see ‘?prcomp’
- rename: the method for change the sample and group names, two argment can choose, “diy” is for the creat a data for name,“replace” is use regexp to replace or change the name
- sample_group: a data for change the sample and group name, the rownames is sample and the first column is group
- dispaly_sample: if TRUE will add the text labels on points.
其实参数就是三个大类, retx,center,scale都是pca分析的参数.而分组信息的添加有两种方式,第一种是rename = diy,这个时候需要自己输入一个命名矩阵.
as.data.frame(c(rep("A",5),rep("B",5))) -> group
rownames(group) <- colnames(test[,-11])#第11列是注释信息
colnames(group) <- "group"
head(group)
## group
## Test1 A
## Test2 A
## Test3 A
## Test4 A
## Test5 A
## Test6 B当组成这样的矩阵后,就可以输入PCA中,就像:
pca(test_tidy,sample_group = group)#其中rename = diy是默认选项,等价于`pca(test_tidy,rename = diy,sample_group = group)`## ...Notice: the sequence of sample names
## ...must be matched for the input data rownames
## ...If not,the result probably is wrong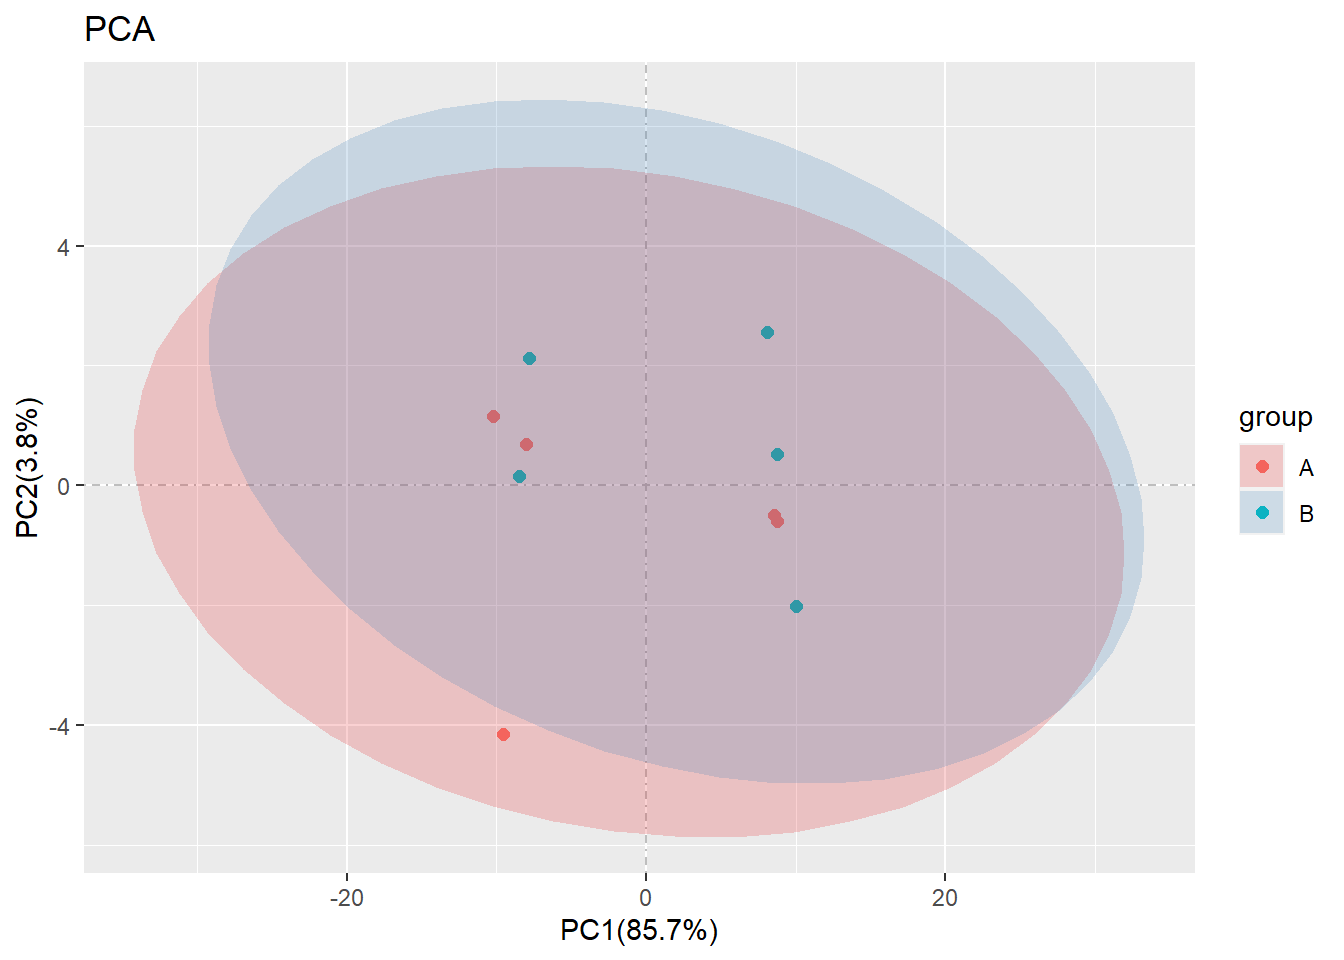
另外一种命名方式就是rename = replace,这个比较难,主要针对会正则表达式的同学.比如你的样本名称是CK1-1_fpkm,CK1-2_fpkm,CK1-3_fpkm这样的.
那其实用rename = replace, str_group = "-.*", str_sample = "_.*"就会很方便.
好吧,这个功能我自己我也没测试过.因为一直没用上.
还有一个参数dispaly_sample,就是 TRUE or FALSE, 如果是 TRUE 就显示样本名称, 反之则不显示. 简单!
pca(test_tidy,sample_group = group, display_sample = T)## ...Notice: the sequence of sample names
## ...must be matched for the input data rownames
## ...If not,the result probably is wrong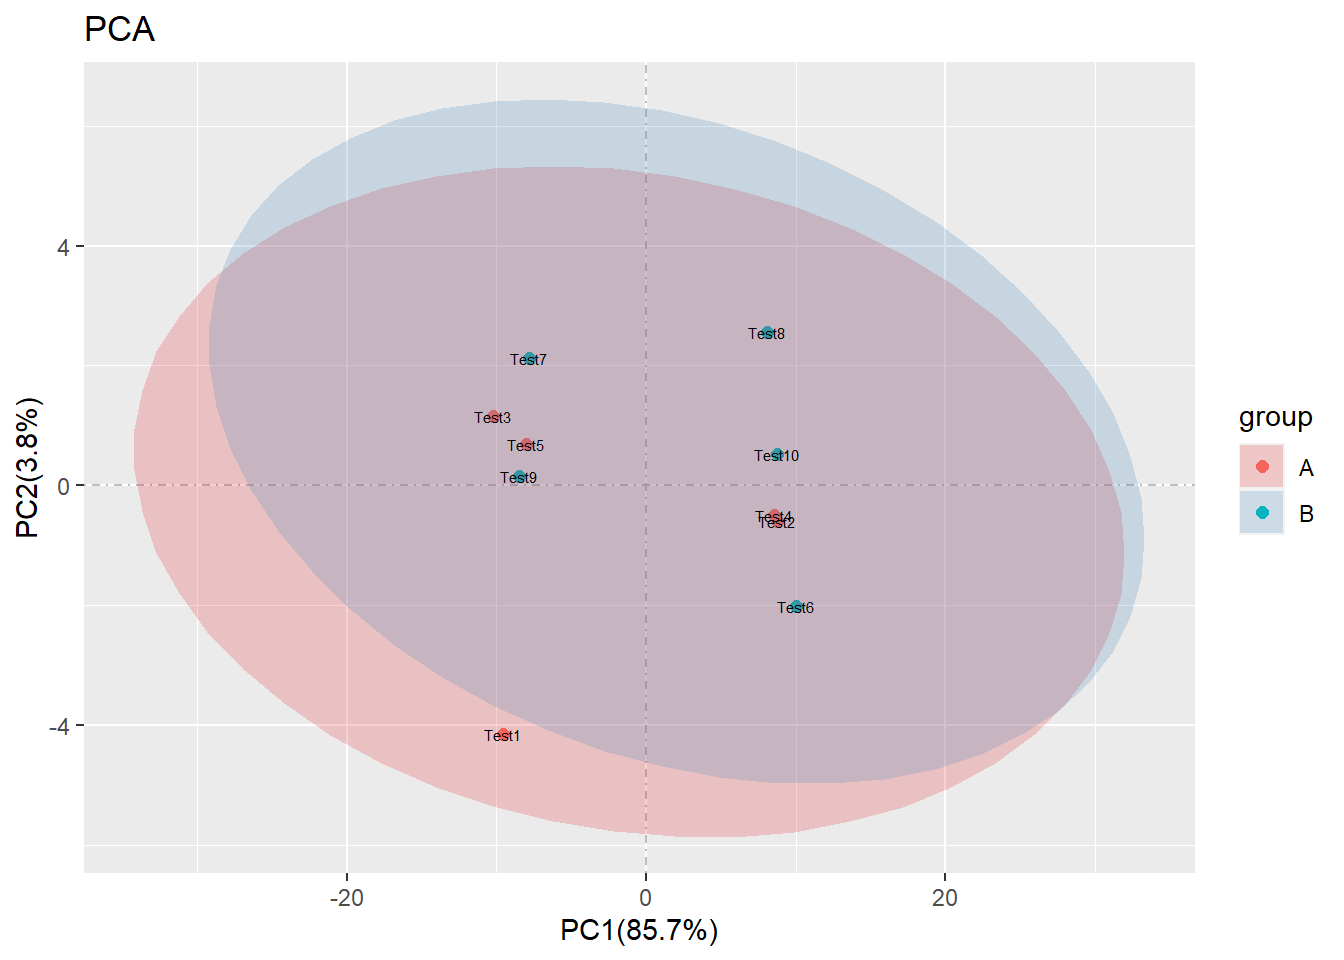 最后的最后,我其实想说:自从我写了这个R包,一次也没用上,全部都是自己造例子,太辛苦了.所以我决定公布出来,大家有需要的时候自己用下,有bug的时候,可以在直接在文章下面留言.
不论是博客还是微信公众号都有相应的评论功能.
最后的最后,我其实想说:自从我写了这个R包,一次也没用上,全部都是自己造例子,太辛苦了.所以我决定公布出来,大家有需要的时候自己用下,有bug的时候,可以在直接在文章下面留言.
不论是博客还是微信公众号都有相应的评论功能.