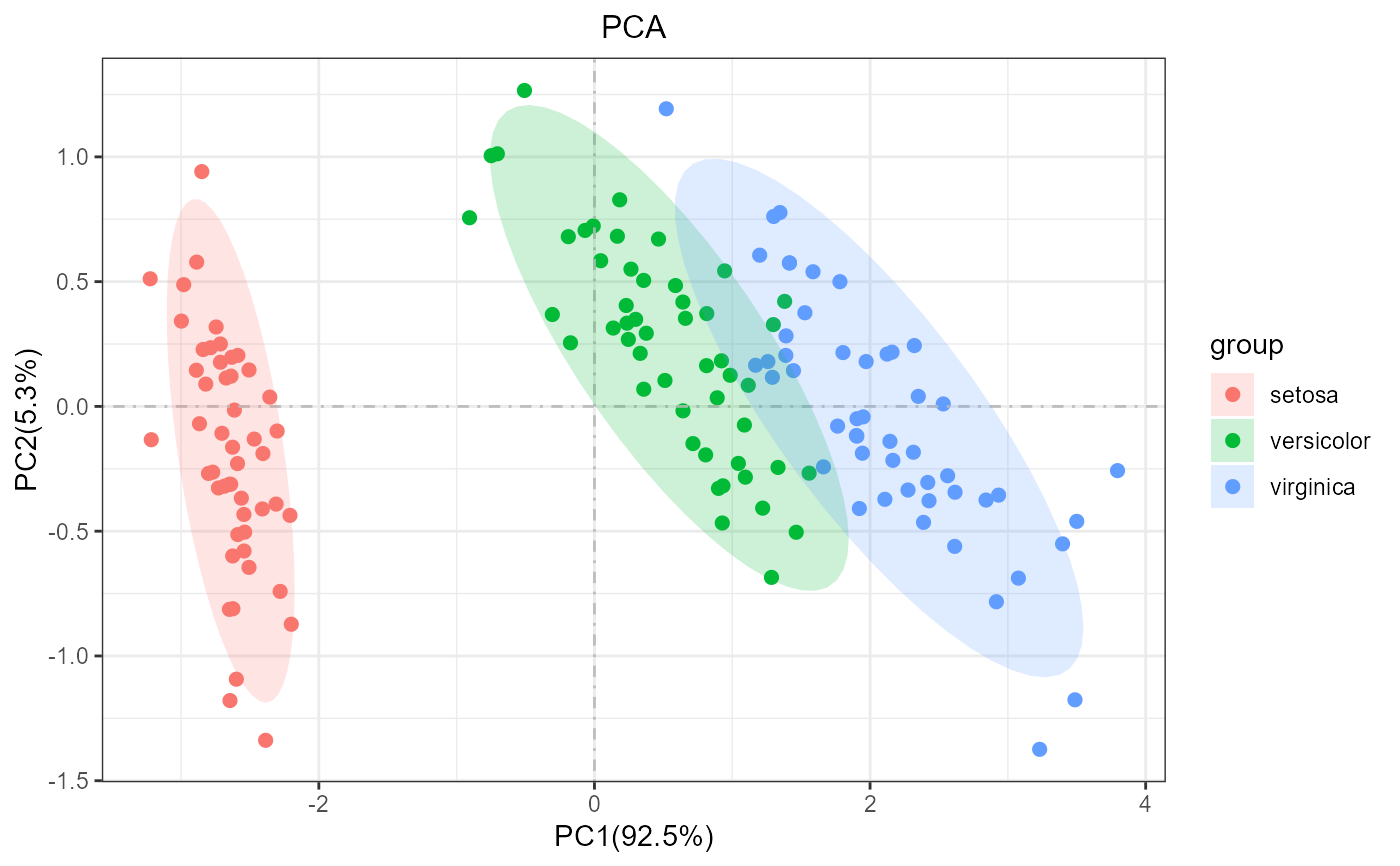
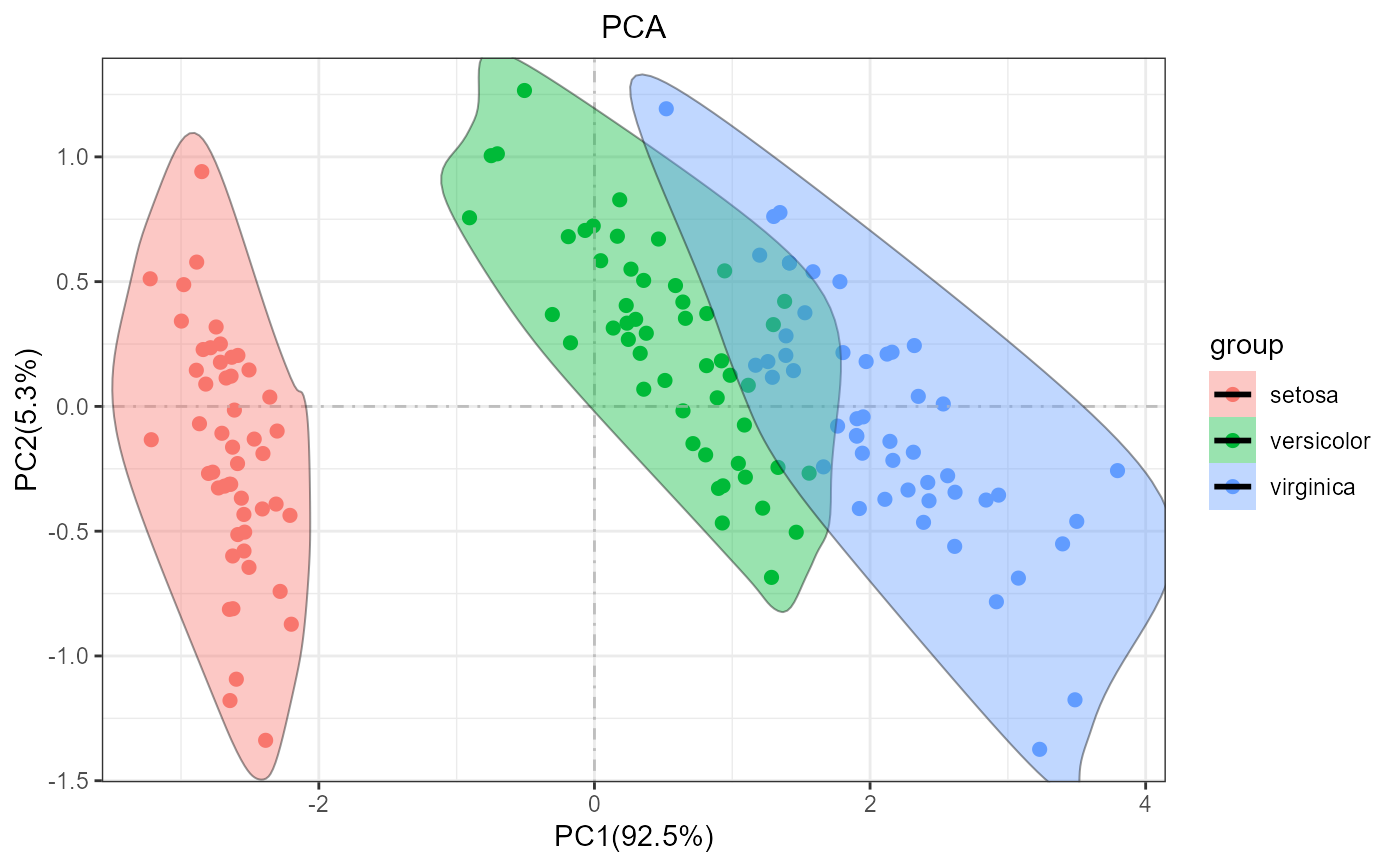
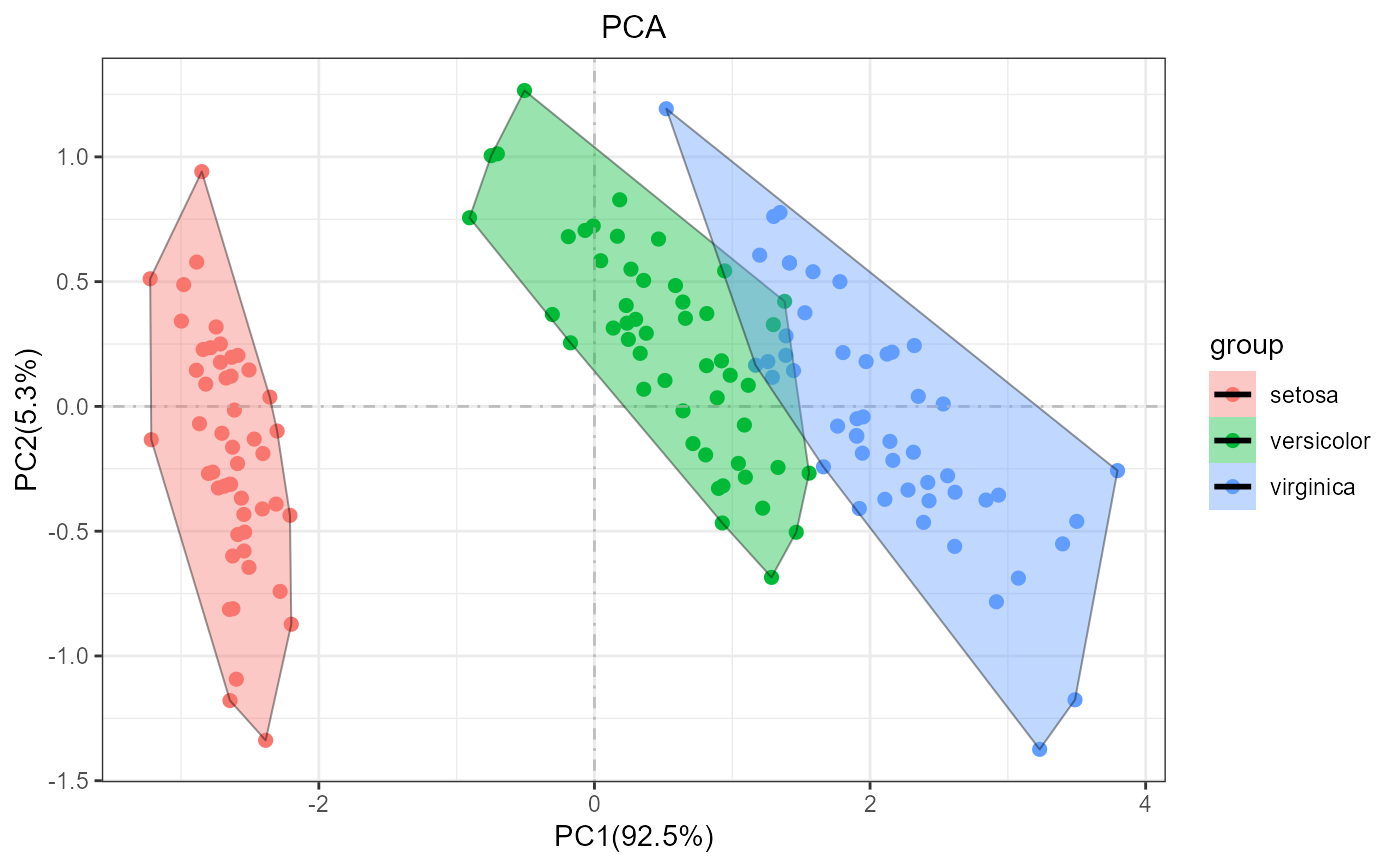
PCA plot
pca(
  data = data,
  center = T,
  retx = T,
  scale = FALSE,
  display_name = FALSE,
  rename = c("diy", "replace"),
  sample_group = NULL,
  str_sample = NULL,
  str_group = "-.*",
  add_ploy = c("null", "ellipse", "encircle", "polygon"),
  name_size = 4,
  point_size = 2
)
Arguments
| data | iput data form the function 'pca_data_tidy' or a matrix of column(gene) and row(sample). |
|---|---|
| center | the prcomp param, detail see '?prcomp' |
| retx | the prcomp param, detail see '?prcomp' |
| scale | the prcomp param, detail see '?prcomp' |
| display_name | if TRUE will add the text labels on points. |
| rename | the very important parameter,if don't input the rename parameter, will take it as no group. and rename default is "diy", the method for change the sample and group names, two argment can choose, "diy" is for the creat a data for name use the parameter "sample_group", if rename = "replace" is use regexp to replace for change the name by the parameter "str_sample" and "str_group". |
| sample_group | need the parameter only when rename = "diy", a data frame for change the sample and group name, the rownames is sample and the first column is group. or a tibble ,the first column is sample name and the second column is group names. |
| str_sample | need the parameter only when rename = "replace", the 'regexp' for the sample name to become the target name |
| str_group | need the parameter only when rename = "replace", the 'regexp' for the group name base on the sample names haved changed by "str_sample". |
| add_ploy | will add the ploy line to encircle the sample points, can choose the ploy style form "ellipse","encircle","polygon", see the plot in example. the default is "polygon". |
| name_size | the font size of sample name. |
| point_size | the size of the piont |
Value
a ggplot object


